Challenge background
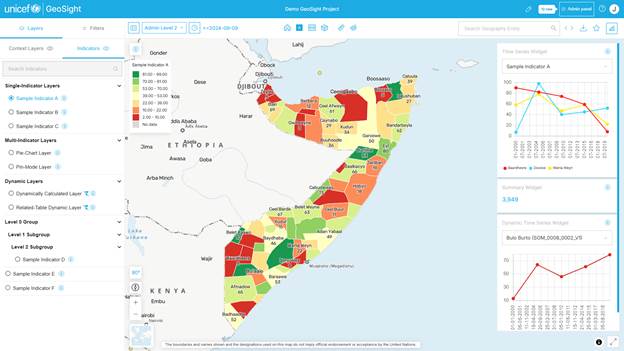
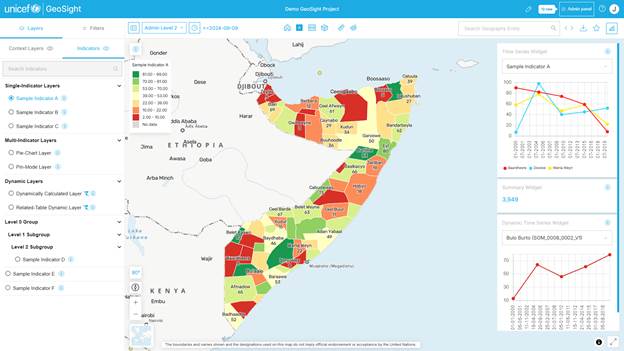
GeoSight is UNICEF's open-source geospatial web-based data visualization and analysis platform designed to make geospatial data easily accessible and shareable in support of risk-informed programming. It utilizes administrative reference datasets from GeoRepo to display data. Projects in GeoSight combine different elements such as reference datasets, indicators, and context layers, enabling comprehensive data visualization and analysis for end-users.
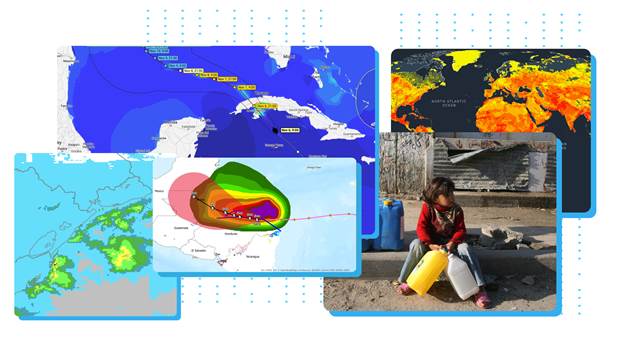
Effective disaster preparedness requires not only access to data but also intuitive visualization and scenario planning capabilities. While GeoSight provides a solid foundation for geospatial analysis, it lacks specific functionality for working with natural hazard datasets, such as hurricanes and interactive "what-if" scenario modelling that would enable decision-makers to anticipate impacts on children and plan interventions before disasters strike.
This hackathon aims to enhance GeoSight's functionality by implementing new features that improve data analysis, visualization, and user interaction. Participants will collaborate to develop these features, contributing to a more robust and user-friendly platform.
Challenge description
There are several documented enhancements ready for development during the hackathon, for example:
- Improvements to Summary Group Widget
- Add another compare mode: swipe
- Implement Dynamic H3 Binning for Cloud Native Point Layers
- Add Support for H3 Hexagonal Indexing of Indicator Data
- Improve dashboard UI for mobile screens
You will find more feature requests which you can find on our GitHub Repository: https://github.com/unicef-drp/GeoSight-OS/issues?q=is%3Aissue%20state%3Aopen%20label%3AUN-OS-Week-2025
We also encourage participants to think outside the box. If you have an idea for a feature or improvement that could make GeoSight more powerful, user-friendly, or impactful, bring it to life!
This is your opportunity to:
- Brainstorm new features or tools that enhance geospatial data analysis
- Solve challenges users might face in the field
- Build integrations or UI/UX improvements that increase accessibility and usability
Whether you're refining the core or imagining something entirely new—your contribution matters. Innovation often comes from fresh perspectives, so don't hesitate to explore ideas beyond the existing issues!
Feature Request 1: Enhancements to Summary Group Widget
Objective: Enhance the Summary Group Widget in GeoSight dashboards to support more flexible, insightful data aggregation and quick data insights—empowering emergency response and preparedness actions by quickly identifying and prioritizing areas of greatest need during disasters or crisis situations.
Estimated time: 8-12 hours
Issue: https://github.com/unicef-drp/GeoSight-OS/issues/136
Tasks:
- Add additional aggregation functions: MIN, MAX, AVG, COUNT, COUNT_UNIQUE.
- Enable grouping values by administrative names.
- Implement sorting options by geographical names and allow ascending/descending order.
- Introduce a "Top N" filter to display only the top N records based on specific indicators.
Impact: These enhancements to the Summary Group Widget will significantly improve the analytical power and usability of GeoSight dashboards, especially during emergencies where rapid, targeted insights are essential. Emergency managers will be able to instantly surface critical patterns—like the most affected districts or areas with the lowest access to services—without needing to manually sift through raw data. This empowers teams to make faster, data-informed decisions, prioritize interventions, and communicate key findings clearly to both field teams and stakeholders.
Feature Request 2: Add another compare mode: swipe
Objective: Introduce a Swipe Comparison Mode in GeoSight to enhance the ability to visually analyze and compare multiple hazard-related layers, such as hurricanes, floods, droughts, or landslides.
This feature will allow users to interactively swipe between two overlaid map layers, making it easier to identify spatial relationships and overlaps—such as regions affected by multiple hazards or correlations between hazard impact and vulnerability indicators (e.g. access to schools, health services).
By enabling side-by-side comparisons within a single map view, this tool will support more nuanced analysis of complex emergency contexts, facilitate better communication of risk scenarios, and strengthen decision-making for preparedness, response, and recovery planning.
Estimated time: 8-12 hours
Issue: https://github.com/unicef-drp/GeoSight-OS/issues/37
Tasks:
- UI/UX Enhancements
- Add a dropdown menu under the existing "Compare Mode" button to switch between:
- Outline & Fill Mode (existing)
- Swipe Mode (new)
- Design and implement a split-view interface with a vertical swipe bar that separates two layers.
- Layer Selection Logic
- Allow users to select up to two indicator layers for comparison in Swipe Mode.
- Ensure consistent logic with existing compare mode for selecting and displaying indicator layers.
- Map Integration
- Integrate the MapLibre GL Compare plugin (maplibre-gl-compare) or similar tool for enabling swipe functionality.
- Ensure both sides of the swipe view render independently and clearly (left = layer A, right = layer B).
- Legend & Widget Updates
- Display both legends side by side or toggle between them as needed.
- Ensure relevant widgets reflect and synchronize with both selected indicators.
- Performance Optimization
- Optimize rendering for large datasets to maintain smooth interaction with the swipe tool.
- Ensure mobile responsiveness and cross-browser compatibility.
- Accessibility & UX Polishing
- Ensure swipe handle is intuitive and easily draggable.
- Testing & Validation
- Conduct functional testing with different hazard datasets (e.g., hurricane and flood layers).
- Validate accuracy of layer rendering and interactivity in various scenarios.
- Documentation & Support
- Update user documentation to explain how to use Swipe Mode.
- Provide example use cases, especially for hazard layer comparisons.
Impact: The addition of the Swipe Comparison Mode will significantly enhance GeoSight's utility for hazard visualization and analysis, particularly in emergency response, risk assessment, and preparedness planning. By enabling users to visually compare two geospatial layers side by side, this feature will:
- Improve situational awareness by allowing users to easily identify overlaps between hazard layers (e.g. hurricane paths vs. flood-prone zones).
- Support multi-dimensional analysis, such as comparing hazard exposure with indicators of vulnerability (e.g. population density, access to health or education).
- Enable rapid decision-making in crisis contexts by offering an intuitive, visual way to interpret complex spatial relationships.
- Enhance storytelling and communication, especially for non-technical stakeholders who need to understand and act on data quickly.
- Increase user engagement and insight generation by offering a more interactive and explorative approach to data comparison.
- Ultimately, this feature empowers users to gain deeper insights from hazard data, helping humanitarian and development teams make more informed, timely, and targeted decisions.
Feature Request 3: Implement Dynamic H3 Binning for Cloud Native Point Layers
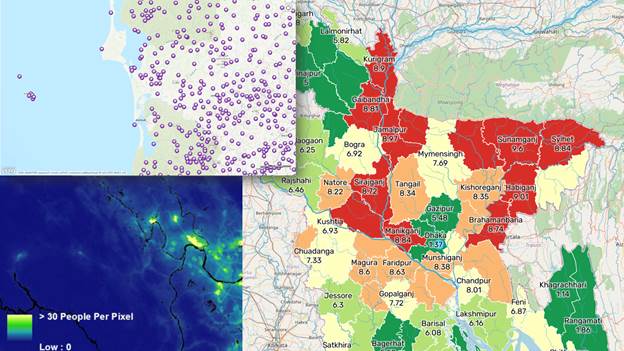
Objective: Enable users to dynamically aggregate and visualize point-based data—such as facilities, incidents, or population data—into H3 hexagonal grids within GeoSight, allowing for clearer spatial pattern analysis, improved performance with large datasets, and more actionable insights in emergency and hazard response scenarios.
Estimated time: at least 12 hours
Issue: https://github.com/unicef-drp/GeoSight-OS/issues/447
Tasks:
- Add support for the H3 spatial indexing library (e.g., Uber's H3) in the platform's backend.
- Implement logic to compute H3 indices for each point in a Cloud Native Point Layer based on dynamic resolution adjusted to support different levels of spatial granularity.
- Enable on-the-fly aggregation of point attributes within H3 cells using common statistical functions (e.g., count, sum, average, max).
- Auto-generate and update the Mapbox Style JSON to reflect selected aggregation and color scheme (e.g., continuous or stepped).
- Create a user-friendly UI panel where users can select aggregation method, choose H3 resolution, pick color style (continuous or stepped) and see real-time preview of changes.
Impact: The addition of dynamic H3 binning for point layers will be a powerful tool in emergency contexts, especially when working with natural hazard data such as hurricanes. During emergencies, decision-makers need to quickly interpret large volumes of geospatial data—such as the location of shelters, clinics, damaged infrastructure, or population clusters. By aggregating these point datasets into H3 hexagonal grids, GeoSight can provide a clearer and more scalable visual representation of impact areas and resource distribution, even in densely populated or data-heavy regions. Unlike administrative boundaries, H3 offers a uniform spatial unit, ensuring consistent analysis across regions and zoom levels.
Feature Request 4: Implement H3 Hexagonal Indexing for Indicator Data
Objective: Enable GeoSight to support indicator data using H3 hexagonal spatial indexing to provide more flexible and precise mapping of critical indicators—such as population vulnerability, infrastructure access, and hazard exposure—in support of real-time emergency preparedness and disaster response.
Estimated time: at least 12 hours
Issue: https://github.com/unicef-drp/GeoSight-OS/issues/447
Tasks:
- Enable Storage of Indicator Data by H3 Tile ID
- Modify data schema to support importing and storing indicator values linked to H3 indexes rather than admin boundaries.
- Implement H3-Based Data Import Workflow
- Allow users to upload datasets where each value is georeferenced to an H3 tile, including validation and tile resolution selection.
- Develop Visualization Engine for H3 Tiles
- Render indicator layers using H3 tiles on the map, supporting existing styling options (such as dynamic or classified color schemes).
- Integrate H3 into Project/Dashboard Workflows
- Allow users to create dashboards using H3-referenced indicator layers.
- Optimize Performance for On-the-Fly Tiling
- Ensure scalable rendering and data handling across varying zoom levels without preloading large shapefiles or geometries.
Impact: Integrating H3 support into GeoSight will dramatically enhance the platform's ability to analyze and visualize data in emergency scenarios, especially where events like hurricanes, floods, or earthquakes do not align with administrative boundaries. It allows for real-time, area-agnostic spatial analysis, offering uniform spatial units that enable consistent and scalable insights across regions. This reduces reliance on potentially outdated or politically sensitive boundaries, improves clarity for decision-makers, and enables faster, more precise targeting of resources and response efforts when every minute counts.
Feature Request 5: Improve dashboard UI for mobile screens
Objective: Redesign the GeoSight dashboard UI to be fully responsive on mobile devices, ensuring that field teams, emergency responders, and decision-makers can seamlessly access, interpret, and act on geospatial data from any device during critical situations.
Estimated time: at least 12 hours
Issue: https://github.com/unicef-drp/GeoSight-OS/issues/38
Tasks:
- Implement Responsive Dashboard Layout
- Redesign layout components to adapt gracefully to small screens (e.g., stacked views, collapsible panels, fluid grids).
- Create Tabbed or Menu-Based Navigation for UI Components
- Move key dashboard sections—such as Context Layers, Indicator Layers, Filters, Map, and Widgets—into mobile-friendly tabs or a hamburger menu.
- Optimize Map and Widget Views for Mobile Interaction
- Ensure the map and data widgets are touch-friendly and clearly legible on smaller screens, with responsive resizing and scroll support.
- Test Across Devices and Screen Sizes
- Conduct usability testing across a range of mobile devices and browsers to ensure consistent behavior and performance.
Impact: A mobile-responsive GeoSight dashboard dramatically increases the reach and utility of the platform in emergency and field settings, where laptops may not be readily available. By ensuring intuitive and readable layouts on smartphones, this enhancement allows emergency teams, program managers, and frontline workers to access critical geospatial insights on the go—whether assessing damage, identifying high-risk zones, or coordinating resources in real time. It enhances agility, improves accessibility, and ensures that data-driven decisions can be made anywhere, anytime.
Feature Request 6: Expand Support for Uploading Cloud Optimized GeoTIFFs (COG)
Objective: Expand the file upload and processing pipeline to support Cloud Optimized GeoTIFFs (COGs) context layers, which are a common raster format that enables fast, scalable access to large geospatial datasets – such as satellite imagery and climate grids – directly over HTTP, making them ideal for web-based Earth observation and GIS applications.
Estimated time: 8-12 hours
Issue: https://github.com/unicef-drp/GeoSight-OS/issues/481
Tasks:
- Add support for COG files for Cloud Native GIS context layers
- Enable upload of COG files
- Validate file format and contents on upload
- Provide user feedback on supported formats and size limits
- Auto-generate layer previews and metadata summaries (e.g. CRS – coordinate reference systems, geometry type, bounds, layer type)
- Store COGs on object storage (or file system), with metadata indexed in database
- Use STAC-like metadata schema for previewing and querying
- Enable preview of COG layers along with styling (color ramp, pixel value classification)
- Enable generating tiles for faster performance and serving as tile layer using a tile server (e.g. titiler, GDAL WMS, or dynamic endpoint)
Impact: Supporting modern cloud-native raster formats such as COGs will:
- Improve interoperability and user experience
- Enable native raster layer uploads (e.g. satellite imagery, elevation models, high resolution population rasters) which are essential datasets for weather and climate related analysis
- Future-proof our platform for scalable, cloud-native workflows
- Maximize developer efficiency by building on top of the existing cloud-native layer infrastructure
Further Information
Participants are strongly encouraged to familiarize themselves with the GeoSight platform and its documentation ahead of the hackathon. Understanding how the platform works will give you a significant head start and allow you to dive straight into building and collaborating during the event.
To make the most of your time at the hackathon, we recommend:
- Deploying a local instance of GeoSight on your machine to identify and troubleshoot any deployment issues and to explore GeoSight features hands-on
- Reviewing the codebase on GitHub to understand the architecture, components, and development workflow
- Identifying the areas you're most interested in contributing to—whether it's UI/UX, data visualization, back-end services, or integrations
We'll also be organizing optional prep sessions before the hackathon to walk through:
- How GeoSight is structured
- How to set up the platform locally
- Where and how to contribute code
- Tips for working with the existing tech stack
These sessions are a great chance to ask questions, connect with fellow participants, and get comfortable with the tools before the main event. Collaboration and innovation are key—let's work together to enhance geospatial insights and build solutions that drive meaningful impact!